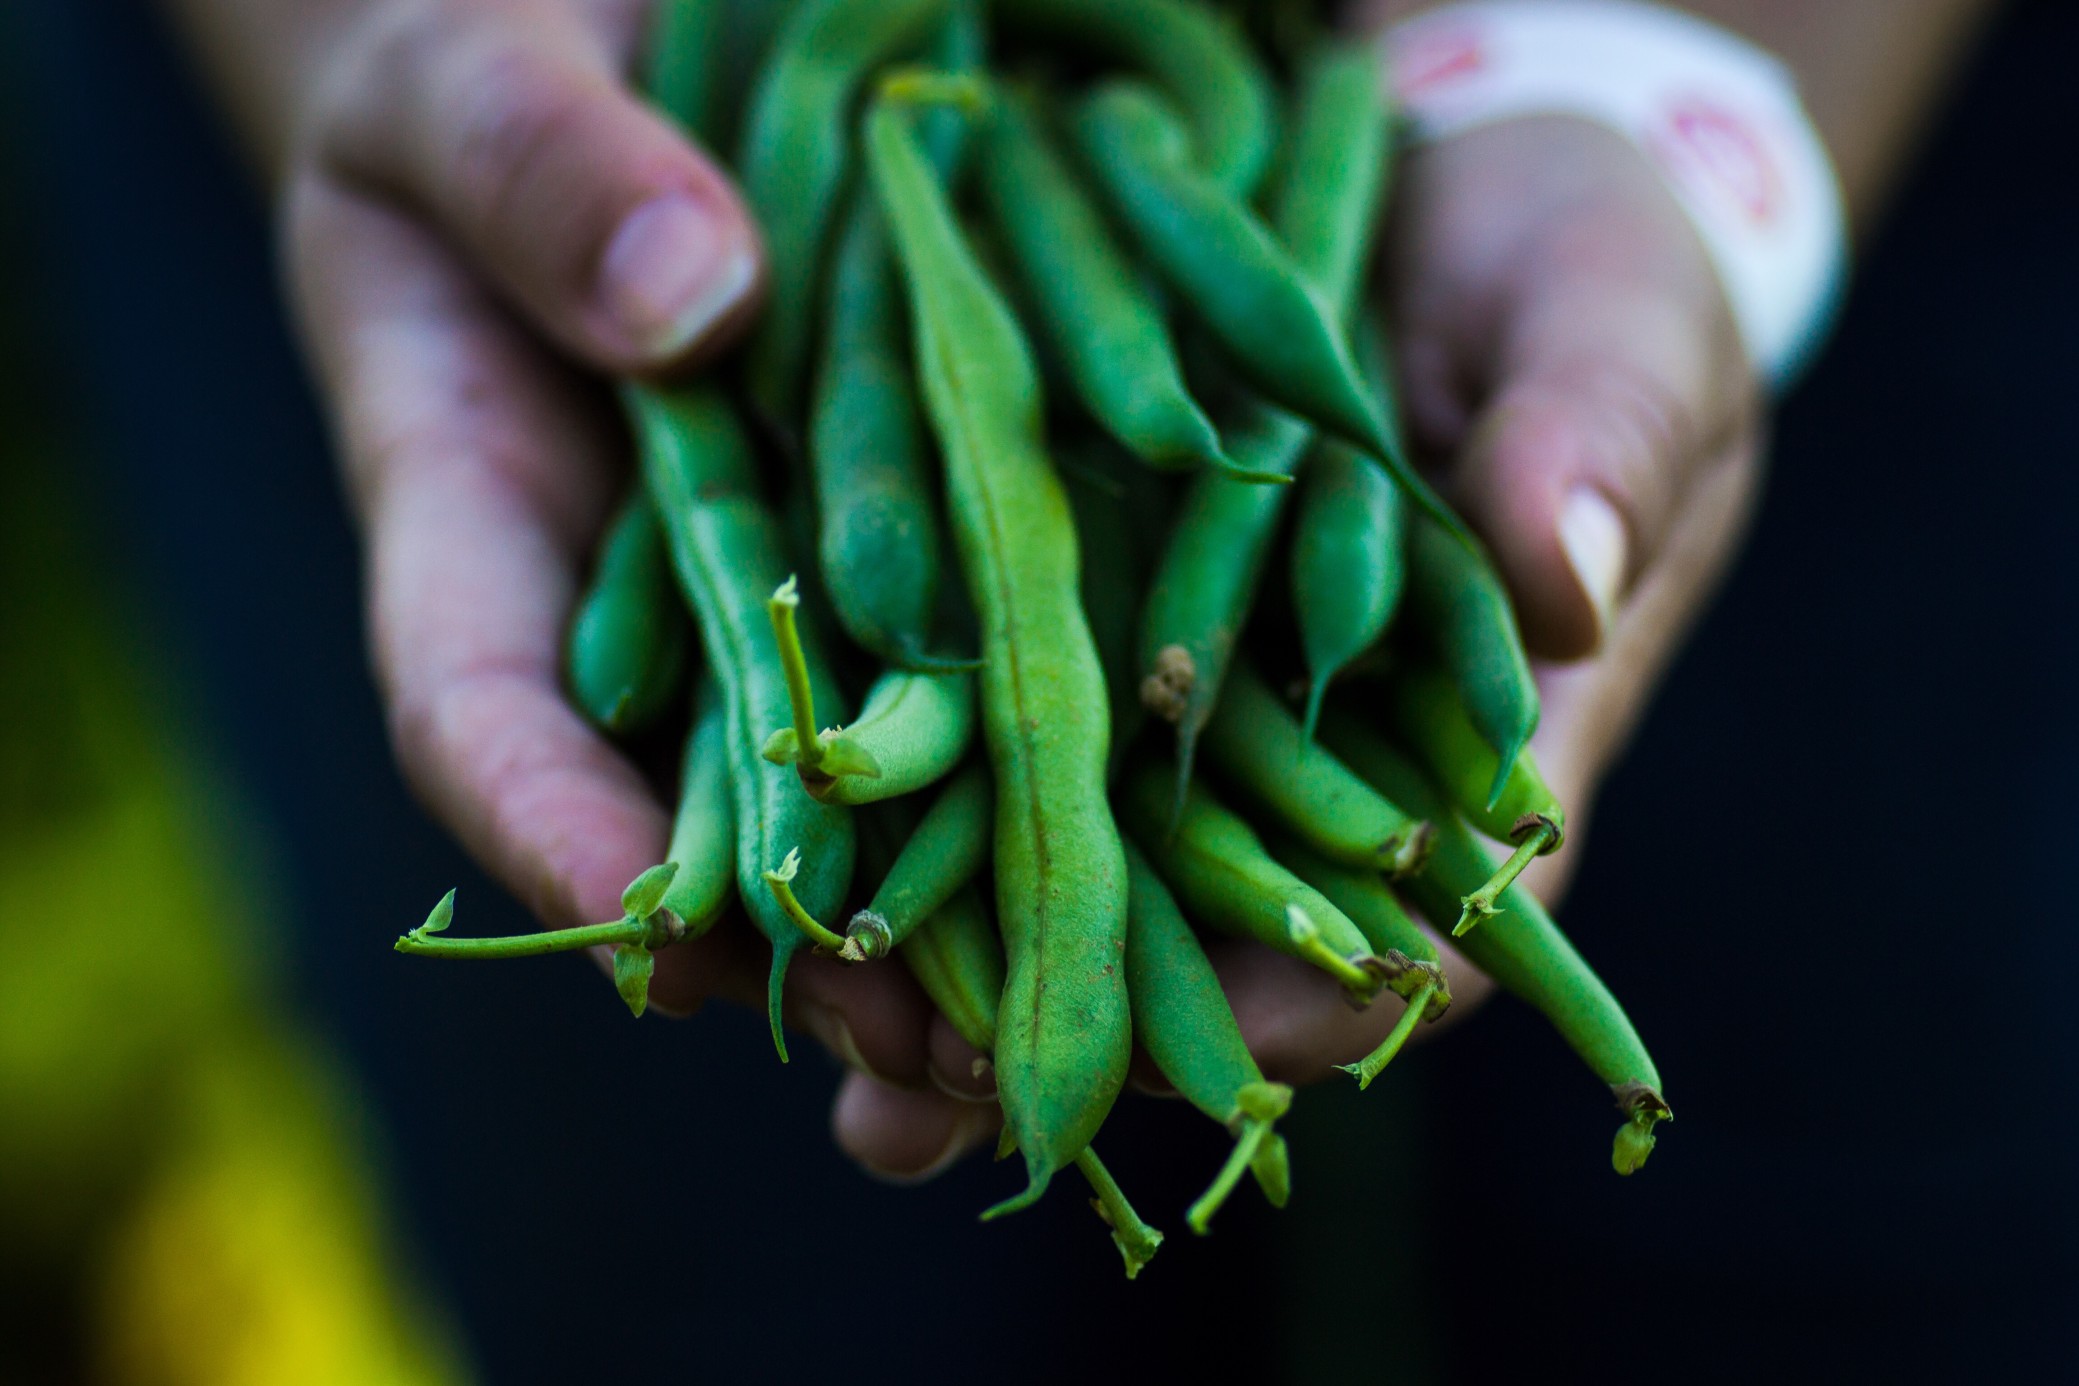
SUCCESSFUL LOCAL FARM BUSINESS
Empower small-scale farm businesses, prioritizing BIPOC- and women-owned farms, to strengthen their business models, create access to new markets, land, and services for increased, sustainable, and economically just production
STRENGTHEN LOCAL FOOD INFRASTRUCTURE
Successful Local Farm Business
Strengthen the food supply chain by providing technical assistance and market-building for small farmers as well as BIPOC and women-owned farms and food businesses. Programs should provide young farmers with training and support; connections to food hubs and other businesses that gather and distribute food products; guidance on leveraging lenders’ diversity commitments and policies; and access to community loan and grant funds so they can buy more land and increase food production.
- Technical assistance that builds capacity and levels the fields for the next generation of farmers
- Market building for BIPOC farmers and women-owned businesses
- Legal aid and other services
- Assessments, strategy development, and program evaluation
This promising strategy requires investment in:
• Technical assistance that builds capacity and levels the fields for the next generation of farmers
• Market building for BIPOC farmers and women-owned businesses
• Legal aid and other services
• Assessments, strategy development, and program evaluation
Evaluation of Promising Strategy in Initial Target Regions
Learn more about the Investment Map’s selection of Initial Target Regions.
The rich heritage of BIPOC, specifically Black, farmers in the region. Many organizations are working on land rights and access issues for BIPOC farmers and communities, including but not limited to: Center for Environmental Farming Systems (CEFS), The Land Loss Prevention Project, The Black Farmers and Agriculturalist Association, RAFI-USA.
There are currently twice as many male farmers as female farmers across the Triad and WNC regions. Of 14,897 producers, 14,562 (almost 98%) are white. Current economic access and opportunities do not promote diversity.
Assets:
- Center for Environmental Farming Systems (CEFS)
- RAFI-USA
- The Black Farmers and Agricultural Association
- The Land Loss Prevention Project
Investment Approach:
- 40 Acres and a Mule Would Be at Least $6.4 Trillion Today—What the U.S. Really Owes Black America View
- Support for a program to pay reparations to descendants of slaves is gaining momentum but could come with a $12 trillion price tag. View
Measures: Living Income Standard
- Increased TA to farmers. Metric = # served with TA.
- Increased land ownership by BIPOC owned farms. Metric = % increase in land owned by BIPOC.
- Increased markets and viability of BIPOC, women, or veteran-owned food and farm businesses. Metric = % increase in sales for business, and % increase in overall profit for business.
- Increased markets and viability of small and mid-size local farms. Metric = % increase in sales for farm, and % increase in overall profit for farm.
- Increased living wage/benefited employment opportunities. Metric = number of FTE generated.
- Increased institutional procurement of local/regional foods. Metric = % of institutional spend ($) on local/regional food products.
- Market access for small and mid-size local farms and food businesses. Metric = number of institutions (hospitals) using alternative purchasing pathways to increase spending with small and mid-sized farms and food businesses.
- Market access for BIPOC owned food and farm businesses. Metric = number of businesses owned by BIPOC and relative percentage to all engaged businesses.
- Decrease in the % community below 200% Federal Poverty Level. Metric = HNC 2030: individuals below 200% FPL (broken down by race).
- Increase in the % community meeting or above NC Living Income Standard for relevant NC city or county. Metric = individuals at or above NC LIS (broken down by race).
- Support for general operating. Metric = amount of $ going specifically into general operating support (not program-related).
The rich heritage of BIPOC, specifically Black, farmers in the region. Many organizations are working on land rights and access issues for BIPOC farmers and communities, including but not limited to: Center for Environmental Farming Systems (CEFS), The Land Loss Prevention Project, The Black Farmers and Agriculturalist Association, and RAFI-USA.
There are currently twice as many male farmers as female farmers across the Triad and WCN regions. Of 14,897 producers, 14,562 (almost 98%) are white. Economic access and opportunities do not promote diversity.
Assets:
- Center for Environmental Farming Systems (CEFS)
- RAFI-USA
- The Black Farmers and Agricultural Association
- The Land Loss Prevention Project
Investment Approach:
- 40 Acres and a Mule Would Be at Least $6.4 Trillion Today—What the U.S. Really Owes Black America View
- Support for a program to pay reparations to descendants of slaves is gaining momentum but could come with a $12 trillion price tag. View
Measures: Living Income Standard
- Increased TA to farmers. Metric = # served with TA.
- Increased land ownership by BIPOC owned farms. Metric = % increase in land owned by BIPOC.
- Increased markets and viability of BIPOC, women, or veteran-owned food and farm businesses. Metric = % increase in sales for business, and % increase in overall profit for business.
- Increased markets and viability of small and mid-size local farms. Metric = % increase in sales for farm, and % increase in overall profit for farm.
- Increased living wage/benefited employment opportunities. Metric = number of FTE generated.
- Increased institutional procurement of local/regional foods. Metric = % of institutional spend ($) on local/regional food products.
- Market access for small and mid-size local farms and food businesses. Metric = number of institutions (hospitals) using alternative purchasing pathways to increase spending with small and mid-sized farms and food businesses.
- Market access for BIPOC owned food and farm businesses. Metric = number of businesses owned by BIPOC and relative percentage to all engaged businesses.
- Decrease in the % community below 200% Federal Poverty Level. Metric = HNC 2030: individuals below 200% FPL (broken down by race).
- Increase in the % community meeting or above NC Living Income Standard for relevant NC city or county. Metric = individuals at or above NC LIS (broken down by race).
- Support for general operating. Metric = amount of $ going specifically into general operating support (not program-related).
FOOD PROMISING STRATEGIES
View other promising strategies for investing in NC’s food systems