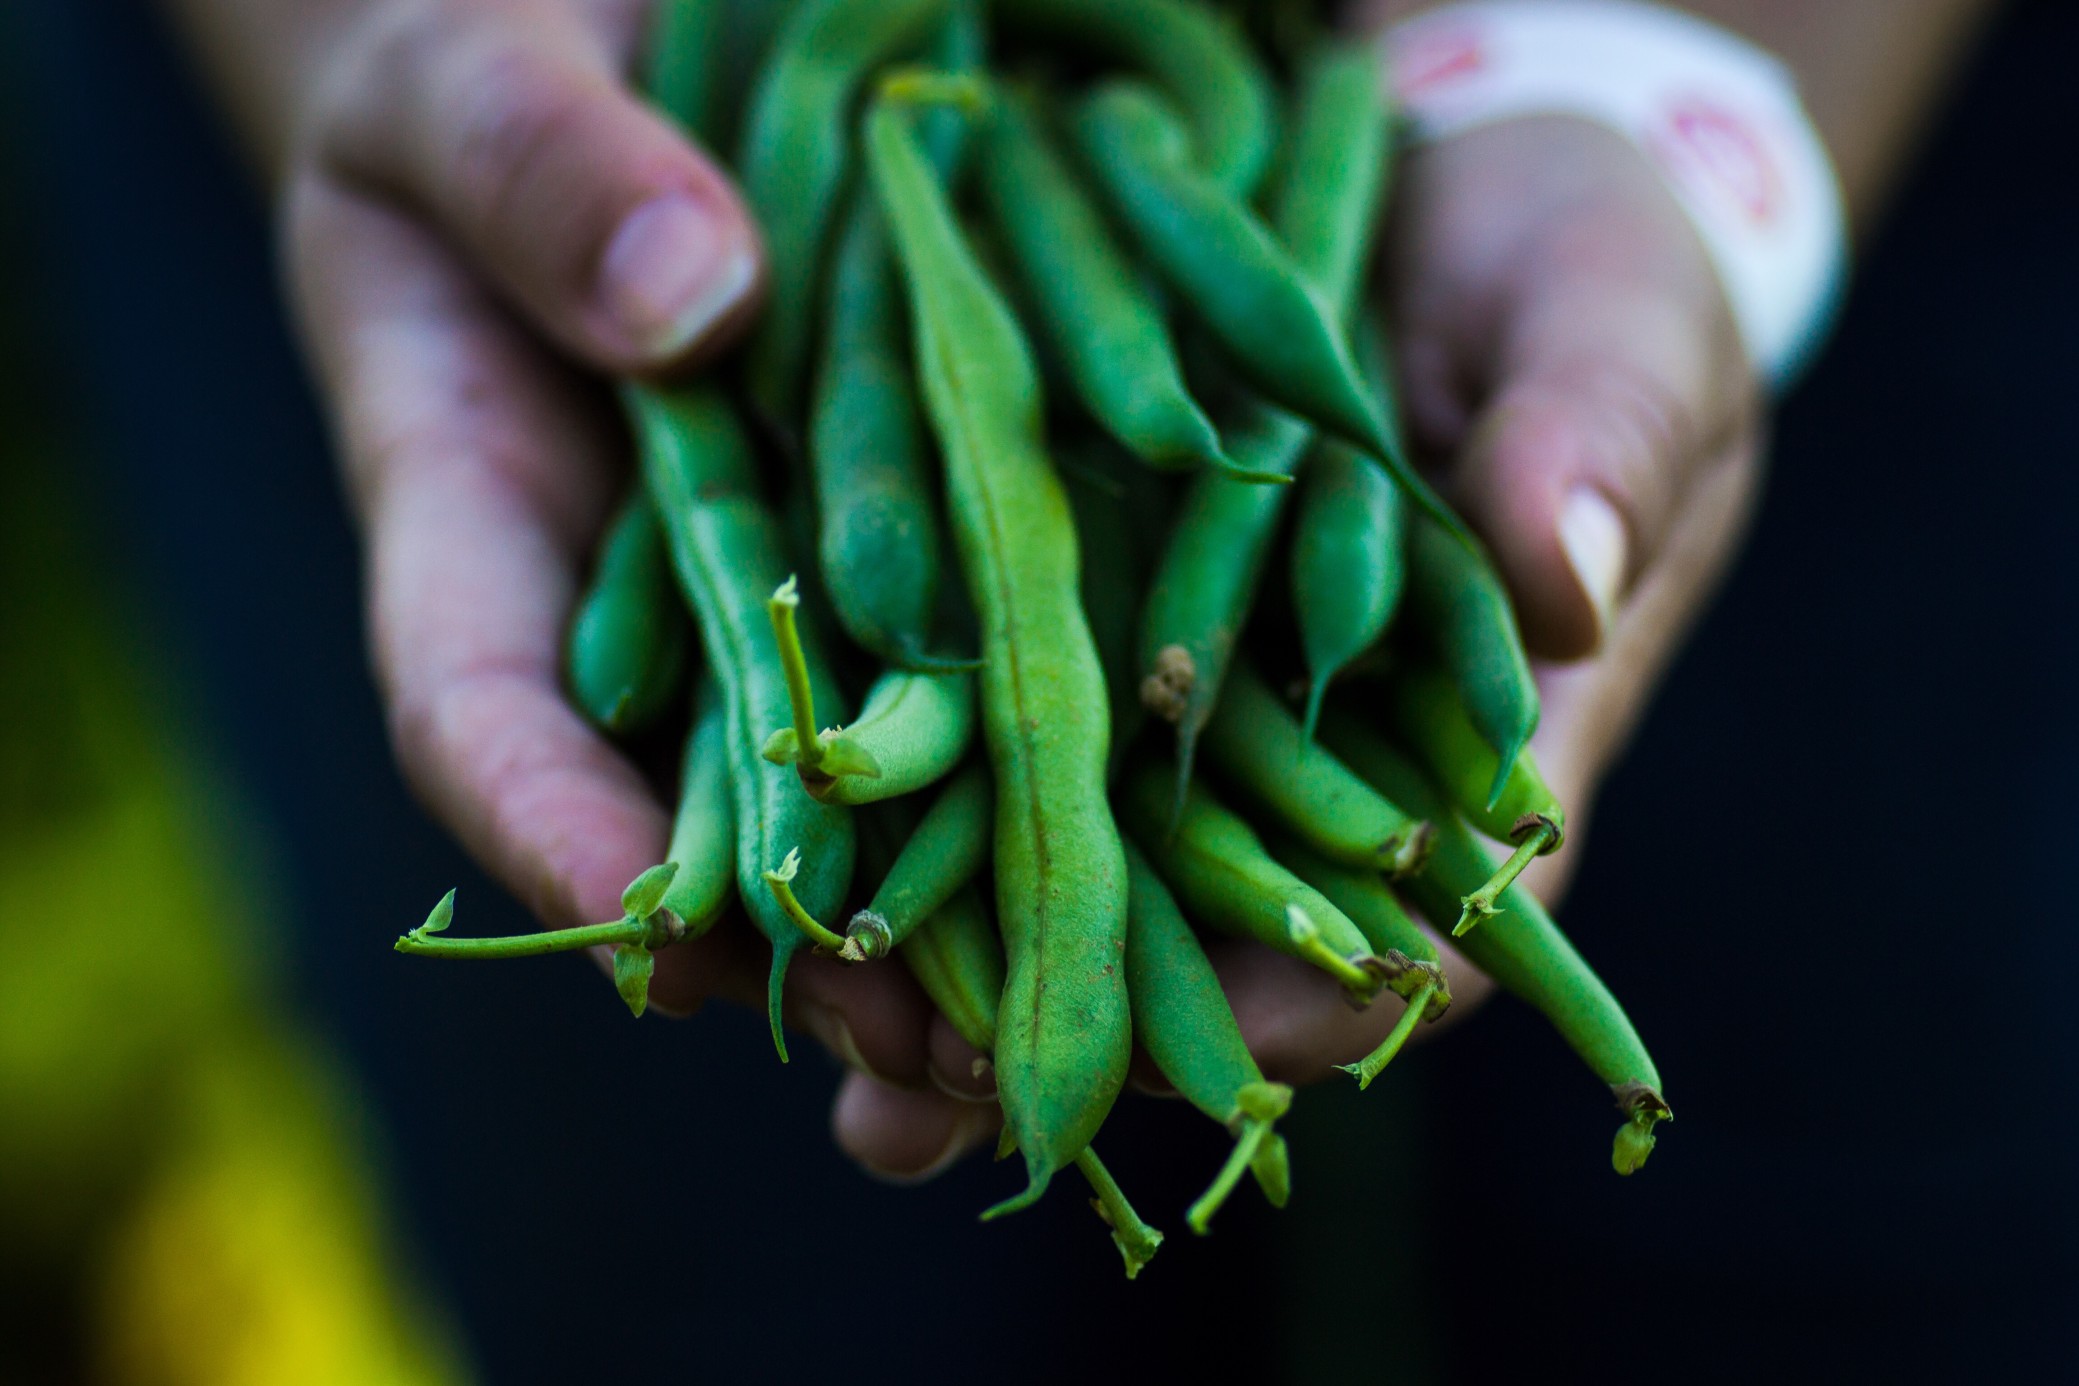
ACCESS TO LOCAL FOODS
Expand and strengthen the local food economy, including farmers markets, mobile markets, and CSAs, so more residents can access healthy foods
STRENGTHEN LOCAL FOOD INFRASTRUCTURE
Access to Local Foods
Expand and strengthen the local food infrastructure, which includes farmers and mobile markets, and subscription-based plans known as Community Supported Agriculture (CSAs) or multi-farm CSAs, to serve the local economy and connect more residents to healthy food. Programs should focus on creating market access for BIPOC food producers; address issues of storage, processing and distribution; and support food producers to find new markets at regional institutions (schools, hospitals, etc.). They should also support “priority communities,” such as people who are food-insecure, and those impacted by COVID-19, in accessing existing programs and incentives like SNAP. This could involve tasks like providing technological support for SNAP/EBT payments at food retailers, and market incentives and training to help farmers meet specific community needs.
- Capacity-building (farms and farmers market administration) to develop market access for BIPOC producers
- Storage, processing, transportation, and distribution
- Management training and technical assistance for food producers
This promising strategy requires investment in:
- Capacity-building (farms and farmers market administration) to develop market access for BIPOC producers
- Storage, processing, transportation, and distribution
- Management training and technical assistance for food producers
Evaluation of Promising Strategy in Initial Target Regions
Learn more about the Investment Map’s selection of Initial Target Regions.
The region has 38 farmers’ markets and existing CSA programs.
Further investment in existing farmers’ markets is needed.
Description: Community Supported Agriculture
- Increased food access program participation. Metric = number/% increase/ relative % of BIPOC to all – of participants in food access programs (demographic information collected that would allow disaggregation of the data).
- Increased procurement of local/regional foods. Metric = % of spend ($) on local/regional food products.
-Increased markets and viability of small and mid-size local farms. Metric = % increase in sales for farm, and % increase in overall profit for farm. - Increased markets and viability of BIPOC, women, or veteran-owned food and farm businesses. Metric = % increase in sales for business, and % increase in overall profit for business.
- Market access for small and mid-size local farms and food businesses. Metric = number of institutions (hospitals) using alternative purchasing pathways to increase spending with small and mid-sized farms and food businesses.
- Market access for BIPOC owned food and farm businesses. Metric = number of businesses owned by BIPOC and relative percentage to all engaged businesses.
- Support for general operating. Metric = Amount of $ going specifically into general operating support (not program-related).
Seven farmers’ markets in Burke, Rutherford, and McDowell Counties. Appalachian Sustainable Agriculture Project (ASAP) is leading the Growing Direct Sales for Appalachian Farms project. ASAP Local Food campaign is increasing public demand for farm products, increasing farmer capacity to access markets, and creating connections within the food system.
Need for investment in existing farmers markets across the region, including SNAP/EBT machines, training, and COVID-related supplies such as hand sanitizer and PPE. Response needed to COVID-related financial impacts.
Assets: ASAP Local Food Campaign
Description: Community Supported Agriculture
Gaps: COVID-19 Impact on Southern Appalachian Farmers and Vendors Selling to Direct Markets
- Increased food access program participation. Metric = number/% increase/ relative % of BIPOC to all – of participants in food access programs (demographic information collected that would allow disaggregation of the data).
- Increased procurement of local/regional foods. Metric = % of spend ($) on local/regional food products.
-Increased markets and viability of small and mid-size local farms. Metric = % increase in sales for farm, and % increase in overall profit for farm. - Increased markets and viability of BIPOC, women, or veteran-owned food and farm businesses. Metric = % increase in sales for business, and % increase in overall profit for business.
- Market access for small and mid-size local farms and food businesses. Metric = number of institutions (hospitals) using alternative purchasing pathways to increase spending with small and mid-sized farms and food businesses.
- Market access for BIPOC owned food and farm businesses. Metric = number of businesses owned by BIPOC and relative percentage to all engaged businesses.
- Support for general operating. Metric = amount of $ going specifically into general operating support (not program-related).
FOOD PROMISING STRATEGIES
View other promising strategies for investing in NC’s food systems
