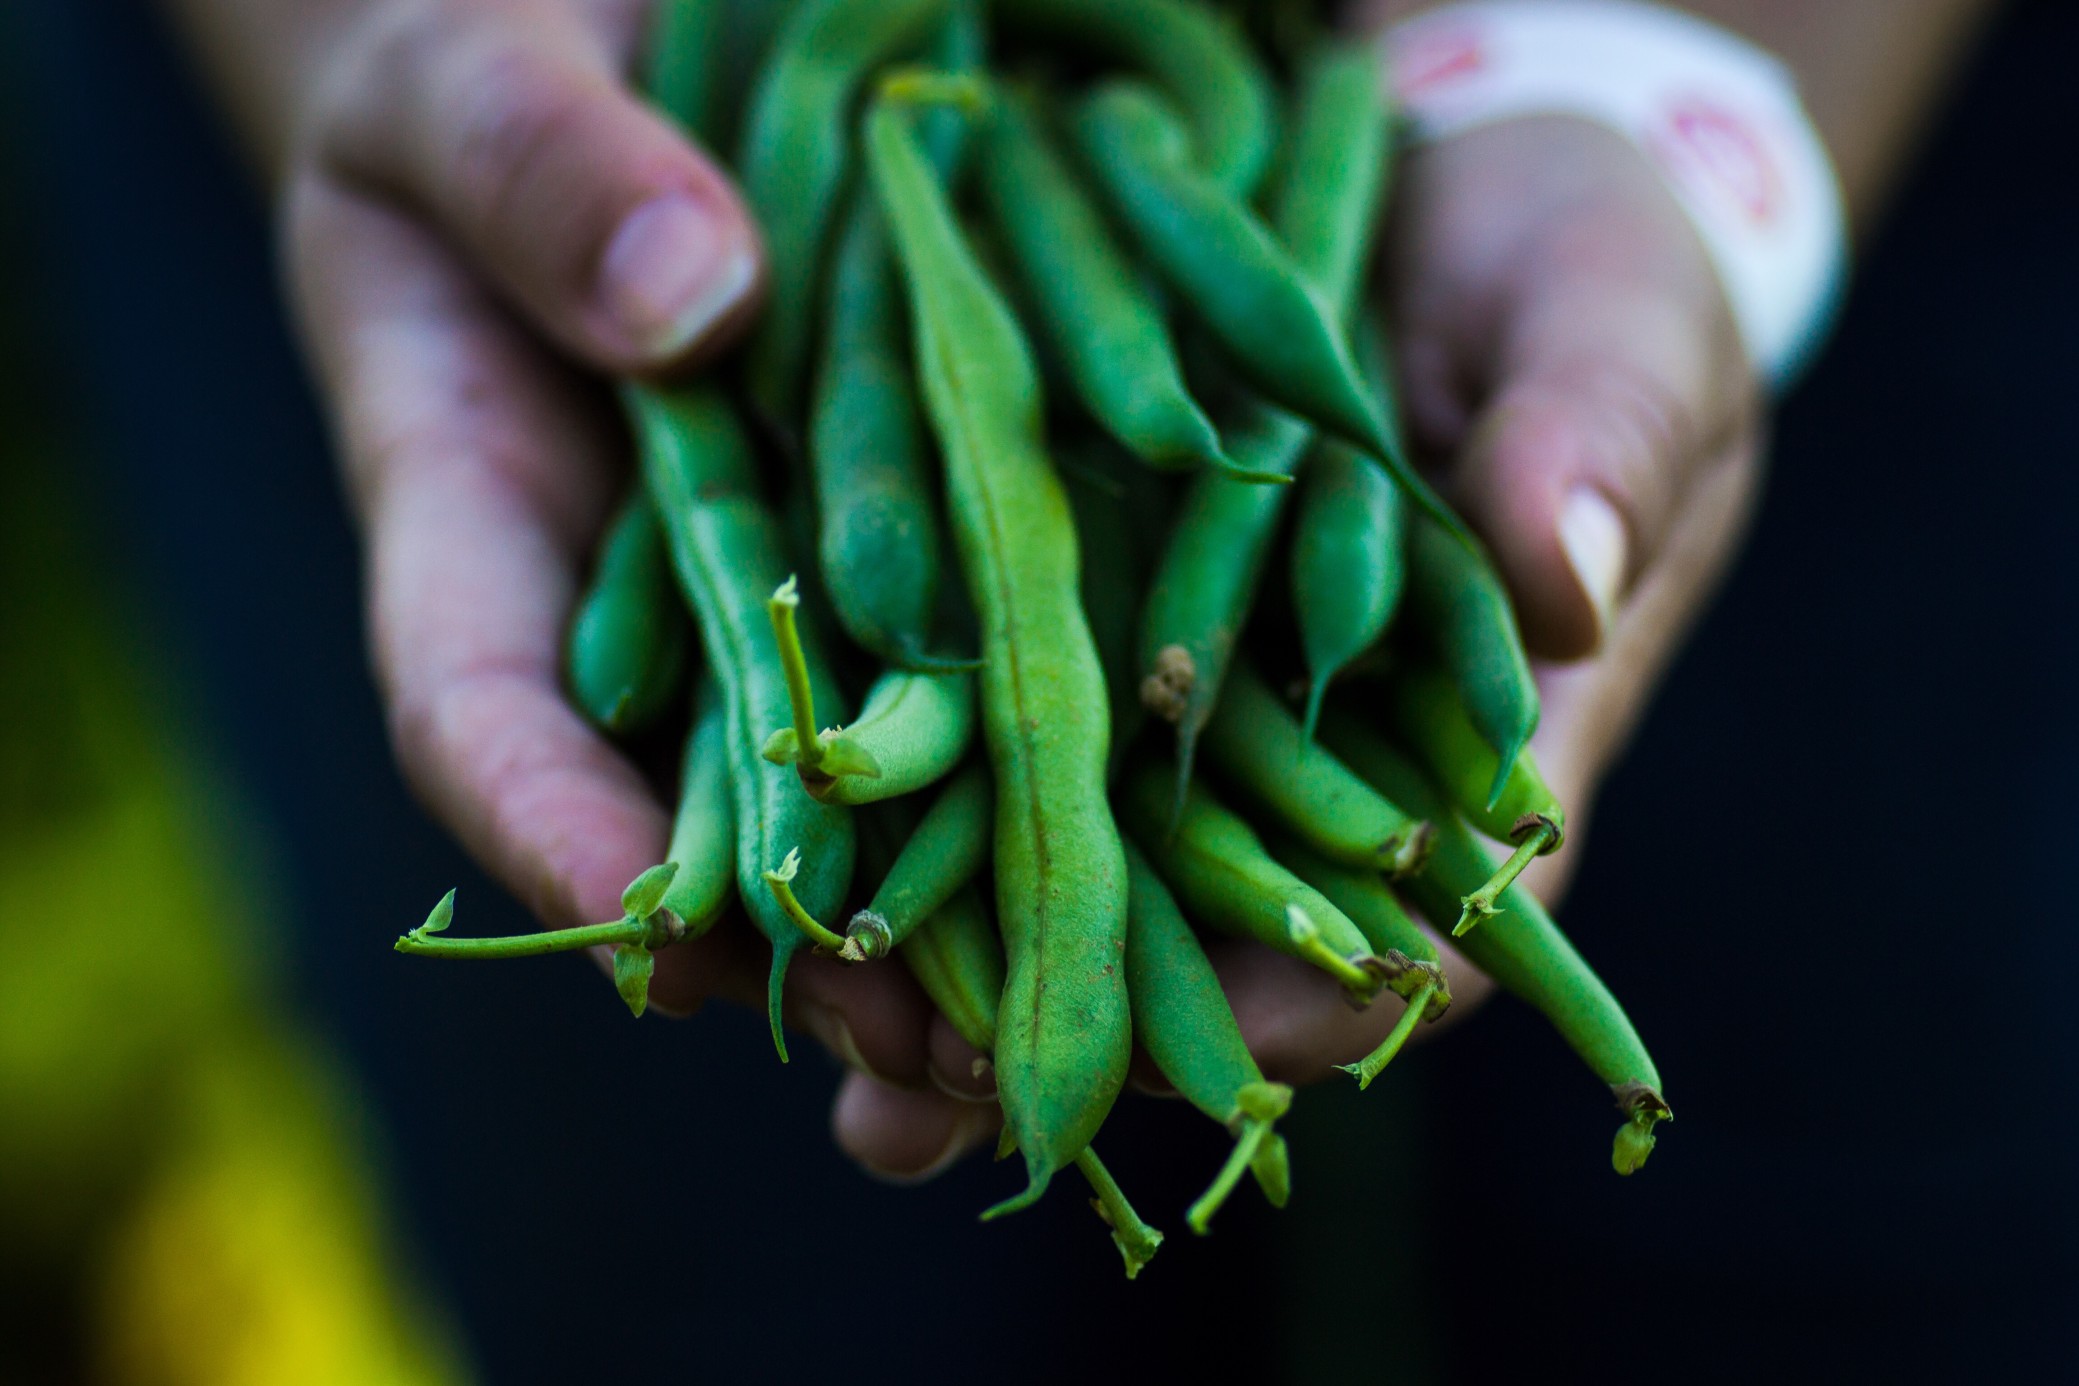
Emergency food system resiliency
Strengthen the local emergency food infrastructure to meet communities’ evolving needs
STRENGTHEN LOCAL FOOD INFRASTRUCTURE
Emergency Food System Resiliency
Utilize new knowledge, obtained during the COVID-19 pandemic, about the role of Emergency Food Providers to build an emergency food system that feeds people who are hungry in a wide range of circumstances, and also provides living wages for food suppliers. During COVID-19, we have witnessed ongoing structural barriers-like an inability to use public transportation-prevent people from obtaining healthy food long-term.
Programs should expand the number of emergency food sites and diversify them to include mobile markets; collaborate with local farmers, food manufacturers and hubs, and restaurants to increase the amount of food available; support local farm economies through purchasing and working with other businesses; support the choice pantries model, which enables customers to choose their own groceries; support home delivery for vulnerable and quarantined community members; create new volunteer pools; and increase access to fair wage employment for emergency food workers.
This promising strategy requires investment in:
- Assessments, project planning, and evaluation
- Capacity building to expand home delivery services, mobile markets, and choice pantry alternatives
- Increased purchasing of emergency food from local farmers and food hubs
- Development of fair wage employment opportunities and pipelines
- Assessments, project planning, and evaluation
- Capacity building to expand home delivery services, mobile markets, and choice pantry alternatives
- Increased purchasing of emergency food from local farmers and food hubs
- Development of fair wage employment opportunities and employment pipelines
Evaluation of Promising Strategy in Initial Target Regions
Learn more about the Investment Map’s selection of Initial Target Regions.
Strong existing network of food pantries (approximately 140 pantries in the Piedmont Triad and Western North Carolina regions). Pantries are mostly housed in churches and schools, which are trusted venues. Pantry infrastructure includes a strong volunteer base. Pantries were transitioning to a choice model before COVID-19.
The largest food bank covering the Piedmont Triad area is Second Harvest.
COVID-19 has had negative effect on infrastructure and operations: Pantries may not have enough food to meet needs; clients cannot access adequate transportation to access pantries; pantries cannot safely use choice model and must revert to pre-packed food boxes and contactless services; and volunteer numbers have dwindled which is creating service gaps.
Assets: Second Harvest Food Bank
Description: Choice Pantries Model
Investment Approach: App Development Costs: Understanding your Budget to Build Powerful Apps
- Increased SNAP enrollment. Metric = # enrolled per # eligible.
- Increased access to food distribution programs. Metric = # of new outlets/programs.
- Increased food access program participation. Metric = number/% increase/ relative % of BIPOC to all – of participants in food access programs (demographic information collected that would allow disaggregation of the data).
- Increased procurement of local/regional foods. Metric = % of spend ($) on local/regional food products.
- Increased living wage/benefited employment opportunities. Metric = number of FTE generated through programs.
- Engagement of diverse community voices. Metric = % of participants at the Table who are directly from within the community (>50%).
- Support for general operating. Metric = amount of $ going specifically into general operating support (not program-related).
- Increase community-level access to healthy foods. Metric = HNC 2030: % of people who are low-income that are not in close proximity to a grocery store.
Rutherford & Burke counties are part of a strong network of food pantries (approximately 140 pantries between Piedmont Triad and Western North Carolina). Pantries are mostly housed in churches and schools, which are trusted venues.
Gateway Wellness Foundation conducted a needs assessment with five pantries to identify solutions to interconnecting issues like food insecurity, homelessness, addiction, and abuse. Gateway is now working with other stakeholders to develop services.
MANNA has a framework for home delivery services ready for implementation. It was tested as part of the Healthy Opportunities pilot. Food pantry infrastructure includes a strong volunteer base. Pantries were transitioning to a choice model before COVID-19.
An increase of 18-45% in regional food insecurity has had a negative effect on operations: MANNA’s operational costs increased after it leased another warehouse to meet the need. Other emergency food programs have had to do the same.
The Healthy Opportunities Pilot could not continue. Without outcomes from the pilot, it is difficult to find funding for the home delivery model and attract volunteers. Pantries cannot safely use the choice model and must revert to pre-packed food boxes and contactless services. Volunteer numbers have dwindled, which is creating service gaps.
- Increased SNAP enrollment. Metric = # enrolled per # eligible.
- Increased access to food distribution programs. Metric = # of new outlets/programs
- Increased food access program participation. Metric = Number/% increase/ relative % of BIPOC to all – of participants in food access programs (demographic information collected that would allow disaggregation of the data)
- Increased procurement of local/regional foods. Metric = % of spend ($) on local/regional food products
- Increased living wage/benefited employment opportunities. Metric = number of FTE generated through programs
- Engagement of diverse community voices. Metric = % of participants at the Table who are directly from within the community (>50%)
- Support for general operating. Metric = amount of $ going specifically into general operating support (not program-related)
- Increase community-level access to healthy foods. Metric = HNC 2030: % of people who are low-income that are not in close proximity to a grocery store
PROMISING FOOD STRATEGIES
View other promising strategies for investing in NC’s food systems
